Analytics
Know why an ad won, not only that it won.
Group every metric by style, hook, angle, CTA, identity or funnel stage, and see which traits helped and which hurt, with the spend behind each.

01 The bar for a claim
A comparison only counts once it clears its own bar.
$100
and 5 conversions
The bar a comparison has to clear before SocialBuster calls it reliable. Below it you see the real counts and the words “not enough data yet.” A single ad’s trend needs less: $20 of spend and 1,000 impressions in a week.
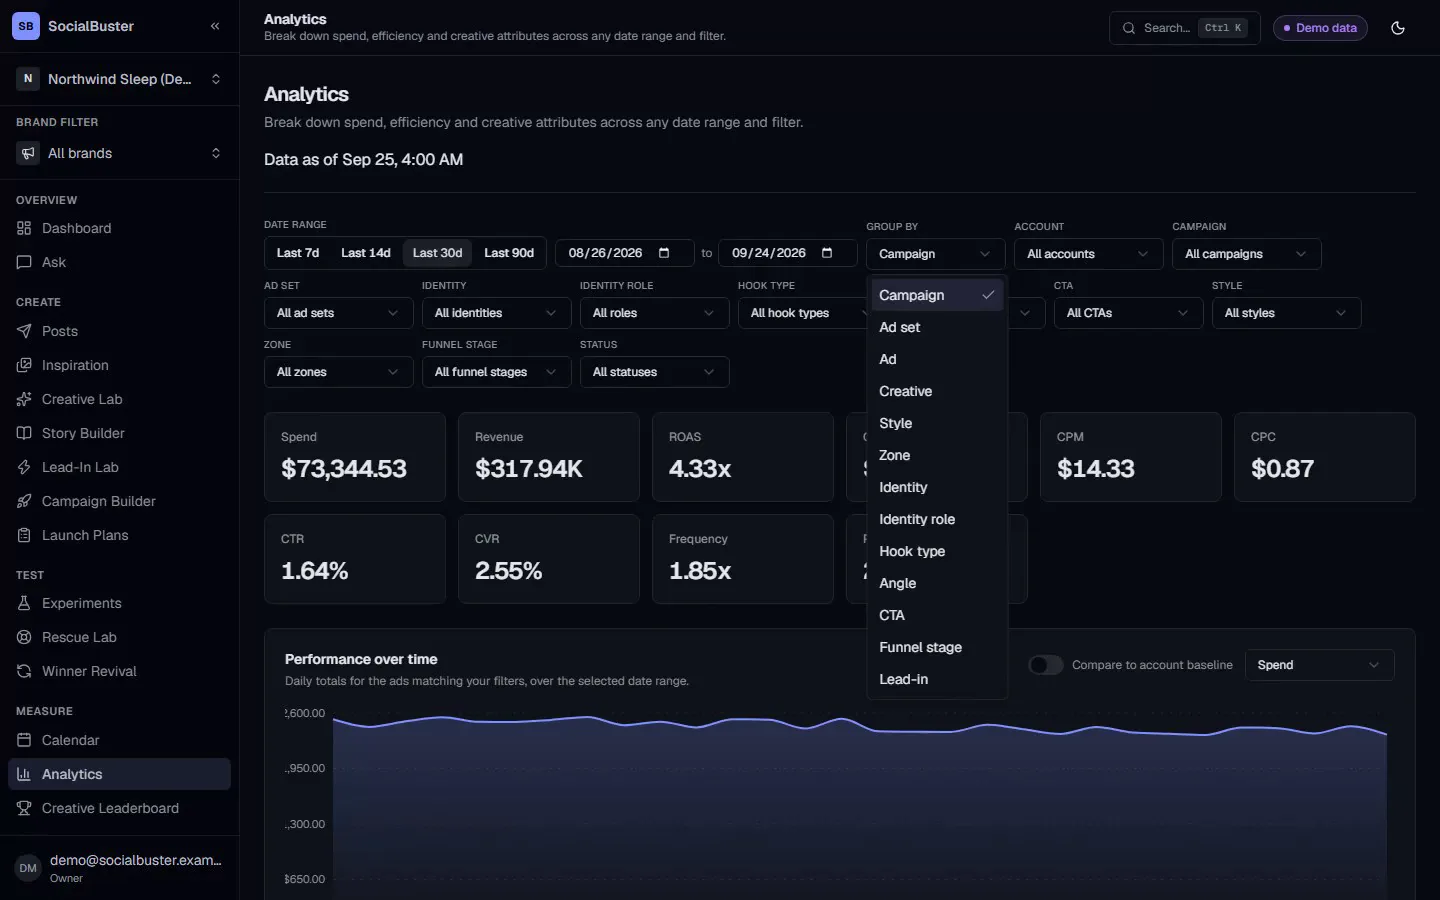
- Campaign
- Ad set
- Ad
- Creative
- Style
- Zone
- Identity
- Identity role
- Hook type
- Angle
- CTA
- Funnel stage
- Lead-in
Account typical rate, CPA $34.15
- Raw−20% CPA · $27.26
- Middle+25% CPA · $42.53
- High production+11% CPA · $37.89
Fig. 2 · Lift against the account’s typical rate, by production zone · Northwind Sleep demo workspace, fictional data
Every attribute’s lift is measured against the account’s own typical rate, never against zero. Founder photo ads are converting at about 1.49x the account's typical rate (+49% lift) across $25,429.91 in spend and 1218 conversions. Figures reflect data over the last 127 days (May 21 to Sep 24). Northwind Sleep demo workspace, fictional data. Below $100 in spend and 5 conversions, a style, hook type or angle prints “not enough data yet” with the real counts instead.
02 Ten metrics, grouped your way
Ten metrics, grouped by any dimension you pick.
Fig. 3 · Analytics, the Group By control · Aug 26 to Sep 24, 2026, Northwind Sleep demo workspace, fictional data
Ten metrics, always in view togetherShow
Spend
Total ad spend over the selected range.
Revenue
Revenue from the purchases Meta reports against the ads.
ROAS
Revenue divided by spend.
CPA
Spend divided by purchases, for a purchase-flow workspace.
CPL
Spend divided by leads, for a lead-flow workspace.
CTR
Link clicks divided by impressions.
CPC
Spend divided by link clicks.
CPM
Spend per thousand impressions.
CVR
Conversions divided by link clicks.
Frequency
Impressions divided by reach: how many times the average person saw an ad.
03 The Creative Leaderboard
Which headline, image or CTA earned its spend, not which ad it rode in on
The Leaderboard ranks headlines, primary text, descriptions, CTAs, images, videos and links across every ad that used them. Every ranked figure is adjusted: a small test with a lucky result is pulled toward the account’s own average, so it cannot outrank a proven winner on a fluke. The Raw column always shows the unadjusted number beside it.
“Finally, a weighted blanket that does not trap heat”
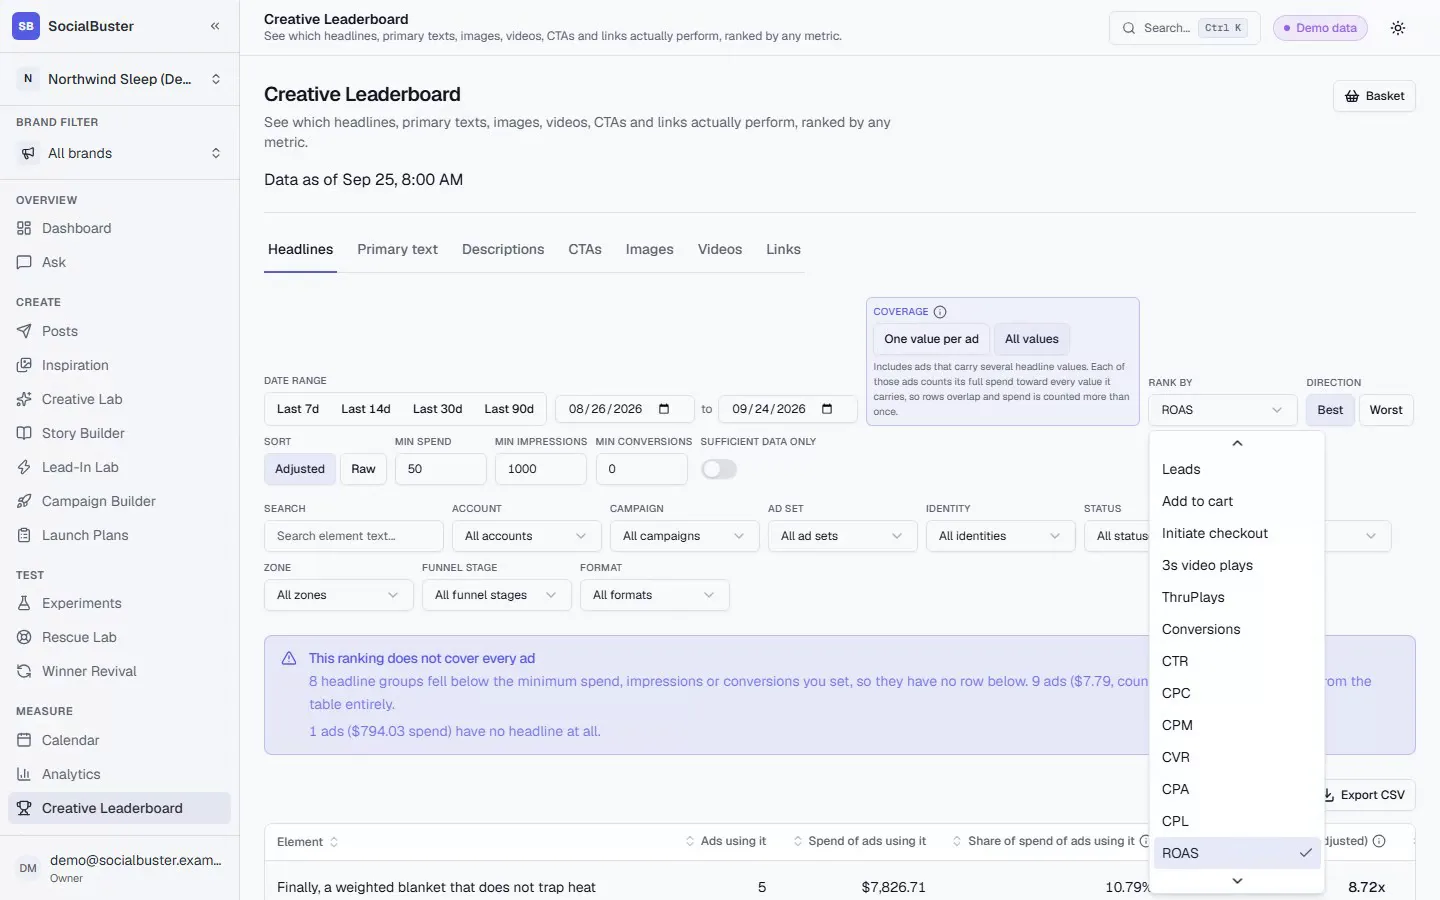
Fig. 5 · 5 ads share this headline, 10.79% of spend in range, 8.72x adjusted · Creative Leaderboard, Northwind Sleep demo workspace, fictional data
Rows overlap: this is co-occurrence, not attribution.
Creative Leaderboard
An ad carrying several headlines counts its whole spend toward every one of them, so a row is the performance of the ads that ran that element, not what the element produced alone. In the demo workspace: “Finally, a weighted blanket that does not trap heat” runs across 5 ads, 10.79% of spend in range, at 8.72x adjusted ROAS.
04 Pages and identity performance
Every ad runs from a Page you are actually authorized to manage.
Every ad and post runs from a Page or Instagram account the workspace is authorized to manage: a brand, founder, creator, employee advocate, editorial or product identity, compared pairwise once each side clears $100 in spend and 10 conversions. Founder Page ads produced a 48% lower CPA than Brand Page ads over this period (n = 19 ads, $69,147.09 spend vs $151,622.04). This comparison is observational: identities were not necessarily run as a controlled split test. Treat it as a lead, not proof, unless the groups shared the same campaign and audience targeting. Figures reflect data over the last 127 days (May 21 to Sep 24). Northwind Sleep demo workspace, fictional data.
Fig. 6 · Pages, identities · Northwind Sleep demo workspace, fictional data. Maya Chen is the demo brand's fictional founder.
05 What a grouped read feeds
The same numbers, carried into three other tools.
- AI Strategist →
Nine checks over these same numbers, ranked by what matters most.
- Rescue Lab →
Ads under the delivery bar this page groups by, scored against your winners.
- Winner Revival →
A winner whose trend, grouped by style or hook, is bending down.
See why your own winners won.
Connect a Meta ad account and SocialBuster syncs its campaigns, ads and daily results. Or load the Northwind Sleep demo workspace and look around first.